Appearance
wireshark io graph
https://www.wireshark.org/docs/wsug_html_chunked/ChStatIOGraphs.html
- io graph 图表
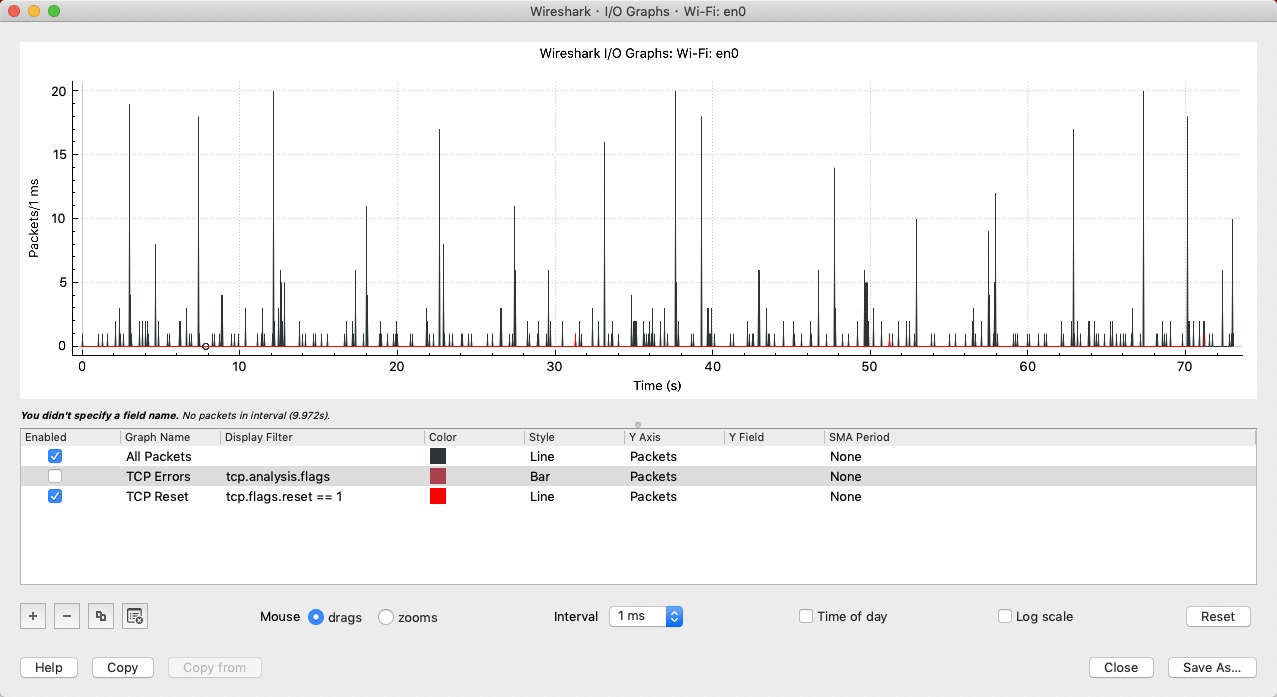
Enabled
Draw or don’t draw this graph.
Graph Name
The name of this graph.
Display Filter
Limits the graph to packets that match this filter.
Color
The color to use for plotting the graph’s lines, bars, or points.
Style
How to visually represent the graph’s data, e.g. by drawing a line, bar, circle, plus, etc.
Y Axis
The value to use for the graph’s Y axis. Can be one of:
Packets, Bytes, or Bits
The total number of packets, packet bytes, or packet bits that match the graph’s display filter per interval. Zero values are omitted in some cases.
SUM(Y Field)
The sum of the values of the field specified in “Y Field” per interval.
COUNT FRAMES(Y Field)
The number of frames that contain the field specified in “Y Field” per interval. Unlike the plain “Packets” graph, this always displays zero values.
COUNT FIELDS(Y Field)
The number of instances of the field specified in “Y Field” per interval. Some fields, such as dns.resp.name, can show up multiple times in a packet.
MAX(Y Field), MIN(Y Field), AVG(Y Field) MIN( ), AVG( ), MAX( ) 分别是统计协议域中数值的最小,平均和最大值。注意,这三个聚合函数只对协议域的值为数字的才有效。
The maximum, minimum, and arithmetic mean values of the specified “Y Field” per interval. For MAX and MIN values, hovering and clicking the graph will show and take you to the packet with the MAX or MIN value in the interval instead of the most recent packet.
LOAD(Y Field)
If the “Y Field” is a relative time value, this is the sum of the “Y Field” values divided by the interval time. This can be useful for tracking response times.Y FieldThe display filter field from which to extract values for the Y axis calculations listed above.SMA PeriodShow an average of values over a specified period of intervals.
Mouse drags / zooms
When using the mouse inside the graph area, either drag the graph contents or select a zoom area.
Interval
Set the interval period for the graph.
Time of day
Switch between showing the absolute time of day or the time relative from the start of capture in the X axis.
Log scale
Switch between a logarithmic or linear Y axis.
The main dialog buttons along the bottom let you do the following:
The Help button will take you to this section of the User’s Guide.
The Copy button will copy values from selected graphs to the clipboard in CSV (Comma Separated Values) format.
Copy from will let you copy graphs from another profile.
Close will close this dialog.
Save As… will save the currently displayed graph as an image or CSV data.
![[Tip]](https://www.wireshark.org/docs/wsug_html_chunked/wsug_graphics/tip.svg) | Tip |
|---|---|
| You can see a list of useful keyboard shortcuts by right-clicking on the graph. |